Measures of classification accuracy for prediction models of the Papaya mealybug based on different parameter settings grouped by model (Herrera Campo., 2018)
Hourly sap flux density of Cordia africana, Coffee under banana shade (Coffee-CB), Coffee under C. africana shade (CC), Coffee without shade (CO) and Banana (Musa sp.), with hourly irradiance and vapor pressure deficit
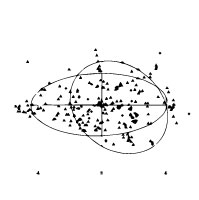
Correlation matrix of, canopy closure, altitude, microclimate and soil water content in three coffee cropping systems (Coffee-Open (CO), Coffee-Banana (CB) and Coffee-shade tree (CT))
Timeline of the coffee sector in Uganda. Line represents total green coffee production in Uganda from 1961 to 2016 based on data provided by FAOSTAT (accessed April 2018)
We use cookies on our website to give you the most relevant experience by remembering your preferences and repeat visits. By clicking “Accept”, you consent to the use of ALL the cookies.
This website uses cookies to improve your experience while you navigate through the website. Out of these, the cookies that are categorized as necessary are stored on your browser as they are essential for the working of basic functionalities of the website. We also use third-party cookies that help us analyze and understand how you use this website. These cookies will be stored in your browser only with your consent. You also have the option to opt-out of these cookies. But opting out of some of these cookies may affect your browsing experience.
Necessary cookies are absolutely essential for the website to function properly. This category only includes cookies that ensures basic functionalities and security features of the website. These cookies do not store any personal information.
Functional cookies help to perform certain functionalities like sharing the content of the website on social media platforms, collect feedbacks, and other third-party features.
Performance cookies are used to understand and analyze the key performance indexes of the website which helps in delivering a better user experience for the visitors.
Analytical cookies are used to understand how visitors interact with the website. These cookies help provide information on metrics the number of visitors, bounce rate, traffic source, etc.
Cookie
Duration
Description
_ga
2 years
The _ga cookie, installed by Google Analytics, calculates visitor, session and campaign data and also keeps track of site usage for the site's analytics report. The cookie stores information anonymously and assigns a randomly generated number to recognize unique visitors.
Advertisement cookies are used to provide visitors with relevant ads and marketing campaigns. These cookies track visitors across websites and collect information to provide customized ads. This website does not use Advertisement cookies.